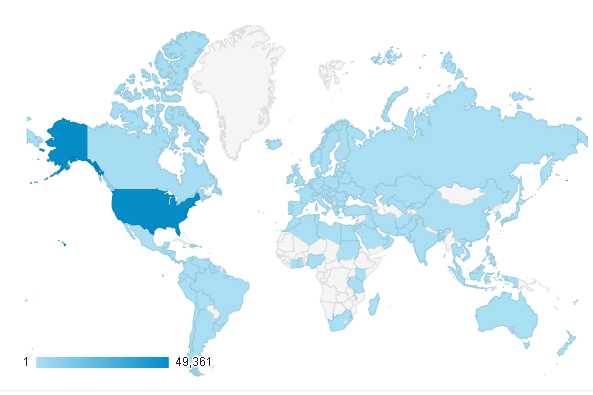
We at OpenCaching North America installed Google Analytics on our main website on May 15th, 2013, and the one year anniversary was just a couple weeks ago. We thought it would be fun to look up the statistics for the year ending on May 15, and do a blog post on them. We are “open” after all, why not make them public? Above you see our world wide hit map for the year. We have visits from 126 Countries. How many Countries are there? You’ll be surprised to hear that opinions vary. But according to infoplease.com, there are 195. So we’ll go with that, and we have visits from 64.6% of them. If you’re a stats geek like our blogger, please read on. You want numbers? We have numbers. Despite us listing less than 2,000 active caches, you may be surprised at our stats. Our webmaster, who has been a loyal user from day 1, but the webmaster for only 14 months, certainly was when the numbers started rolling in.

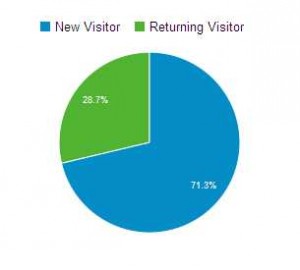
Total visits and top Countries: How many overall visits were there? Exactly 54,570. an average of 149.5 a day, with the overwhelming majority of those visits coming from The United States. That’s why it is colored in darker blue than the rest on the map. The little bar graph at the bottom of the image tells you 49,361 of those visits were from the U.S.; that’s 90.4% of visits. That is total visits by all users, by the way. those 54,570 visits were by 38,845 unique users. The total number of pages viewed on our site was 216,036, an average of 592 a day. To the left you see a pie chart that tells us the percentage of all visitors that were new or returning visitors. You can see that 71.3% (38,898) were new (i.e. first time) visitors. We’ve been told that our 71.3% new visitor rate is outstanding, and a figure many websites only hope to strive for. The top 5 countries by number of visitors are:
- United States 49,361
- Canada 1,251
- Germany 894
- United Kingdom 337
- Poland 257
The last 3 are really not that surprising, being that Germany, The UK, and Poland are Countries with OpenCaching network nodes. Most those visits come from our “Opencaching Friends”. 🙂
Within The United States: We won’t bother showing a U.S. hit map, because not only do we have visitors from all 50 States, we generally fill in the 50 State map every month, as the standard “view” when you log into Google Analytics is for the past month. Our top States by visits were predictable in some cases, surprising in others. The top 10 States and their number of visits for the year were:
- New York 4,151
- California 4,105
- Maryland 3,287
- Texas 2,943
- Florida 2,316
- Virginia 2,141
- Ohio 2,080
- North Carolina 2,047
- Illinois 2,011
- Pennsylvania 1,902
New York edges out California! Having looked at the stats many times over that year, the blogger can tell you that was a back and forth race. The winner is not surprising, your OpenCaching North America webmaster hails from New York, and a webmaster needs to look at their site a lot, right? Although it is true that the Buffalo/Niagara Falls area is one of our “hotbeds of activity” (by our standards, that is). The surprising thing is, we do NOT have that strong of a presence in California. It’s the most populous State, and that population base is producing raw numbers of visits for us. The stats become predictable again from the 3rd position of Maryland, to the 8th position of North Carolina, as all 6 States have a decent amount of caches, again by our standards. North Carolina has the most caches listed on our site. For Illinois and Pennsylvania in the 9th and 10th position, there is not a lot of our caching activity there, and again these are States that get a lot of visits to our site due to their large population. We’re sure people want to know the least visiting State. That would be North Dakota with 83 visits, edging out Vermont with 85. Wyoming has 94, and all other States (and D.C.) have over 100.
 Memberships: An OpenCaching North America account is free, and people like to create free accounts on the internet. It is said that over half of Geocaching.com accounts have never found a cache. We will be forced to admit right now that only about 5% of OpenCaching North America account holders have entered at least one find log on our website! But people register, and they register 365 days a year. There may have been a day or two over our 3 1/2 year existence where no new accounts were registered, but the webmaster hasn’t personally noted one. In the one year period from May 15th 2013 to May 15th 2014, exactly 4,154 users created an account on our website. That is an average of 11.4 users per day. Most accounts are created on weekends, and we had many weekends in the one year period where over 40 accounts were created. These are people who legitimately want to create an account, as well. We vigorously delete forum spambot accounts. Most of these people find us on Google, where we have an excellent ranking for a search of the word “Geocaching”. Do you need an account? Clicking anywhere on the blue button will actually take you to our registration page!
Shortly after installing Google Analytics, we offered “user access” (as opposed to admin access) to our account to anyone who wanted it in our forums, although only two people (other than site admins) took us up on the offer. That offer still stands to any interested parties reading this post. Let us know at octeam at opencaching.us.
Want to install Google Analytics on your own website? First you have to create an account at http://www.google.com/analytics. Then here are the instructions from Google themselves. For a WordPress blog, such as this, or a Blogger.com blog (such as we used to have), you merely have to enter what’s called your Tracking ID into a box. For our main website, we had to copy the Google generated code snippet given, and paste it into “every page you want to track, immediately above the closing </head> tag”, as mentioned in the instructions. However, in our case the file main.tpl.php generates the frame around every single page on our site, and we only had to do it there. If you have an old all HTML website, for example, you’d have to paste it on every page on your website. It’s very easy, and the reports you generate on Google Analytics are amazing.
And lest we forget, we also have installed a traffic measurement code snippet in the same file by the older audience measurement website Quantcast.com. You can see our little “statistics badge” on our blog side bar, and you can click on it for some more detailed data. We happen to like Google Analytics more than we do Quantcast, although in fairness we are comparing the free version of both of them.
